Figure 1
Multi-panel: Changes in Tumor Size, Duration of Treatment, and Time to Response
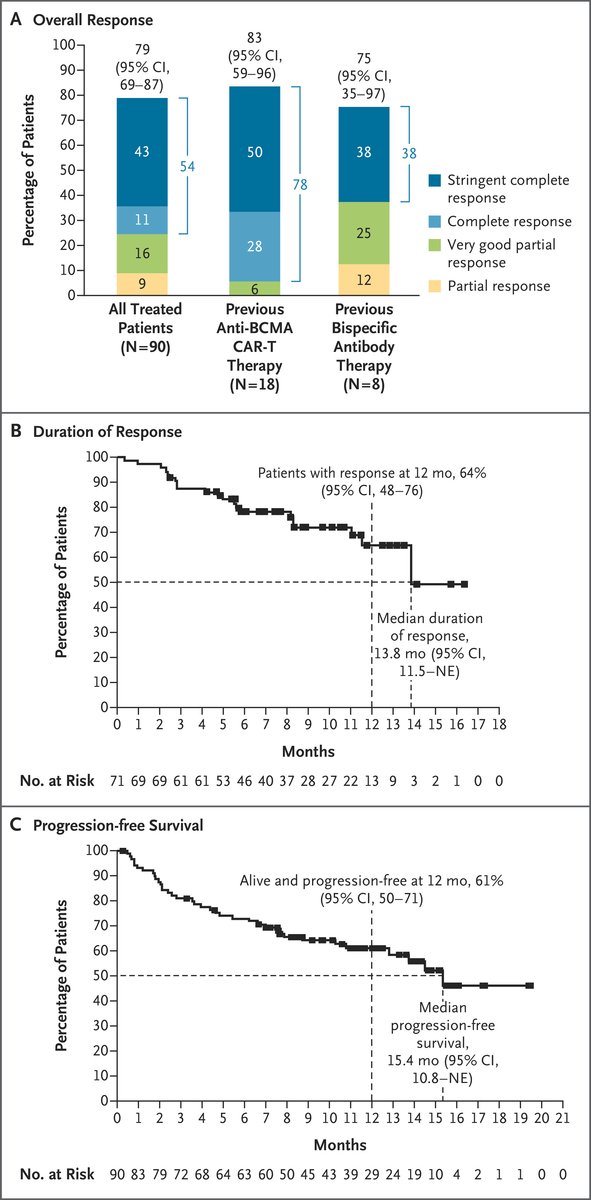
Figure 2
Multi-panel: Changes in Tumor Size, Duration of Treatment, and Time to Response
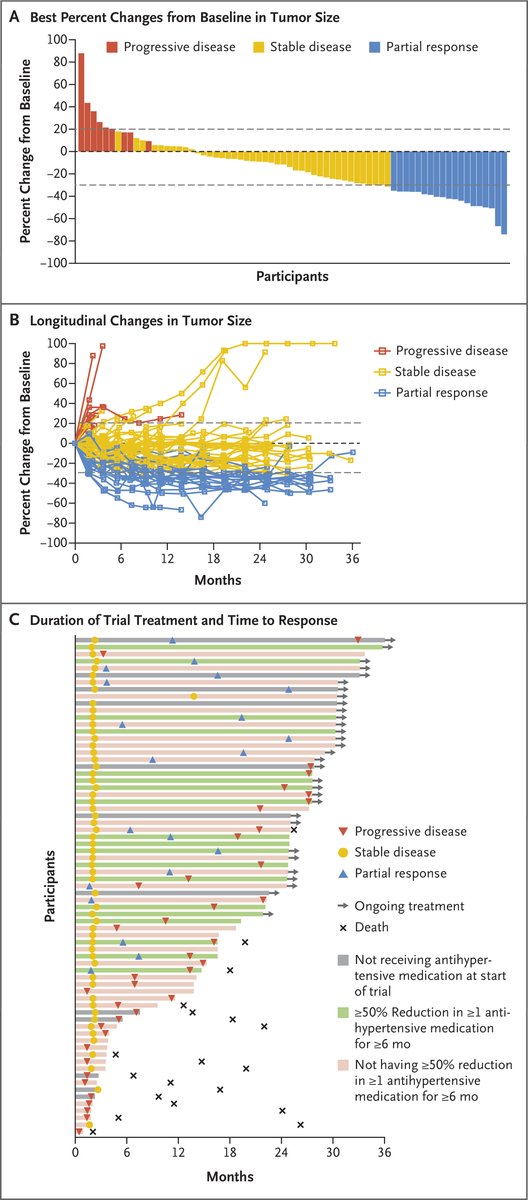
Figure 3
Forest plot
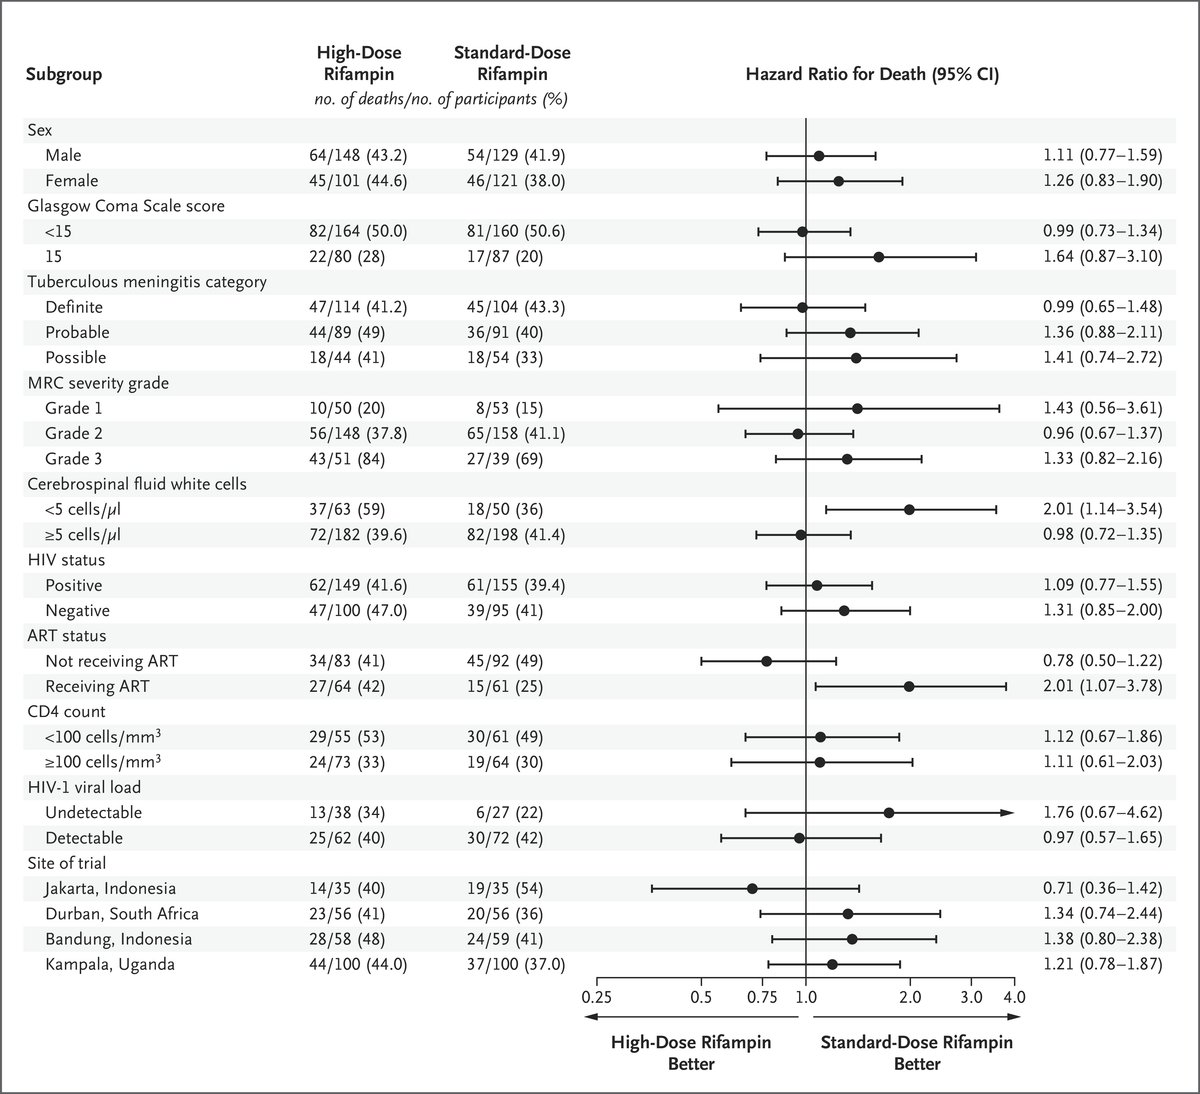
Figure 5
Clinical trial design diagram
Figure 6
Electrocardiogram
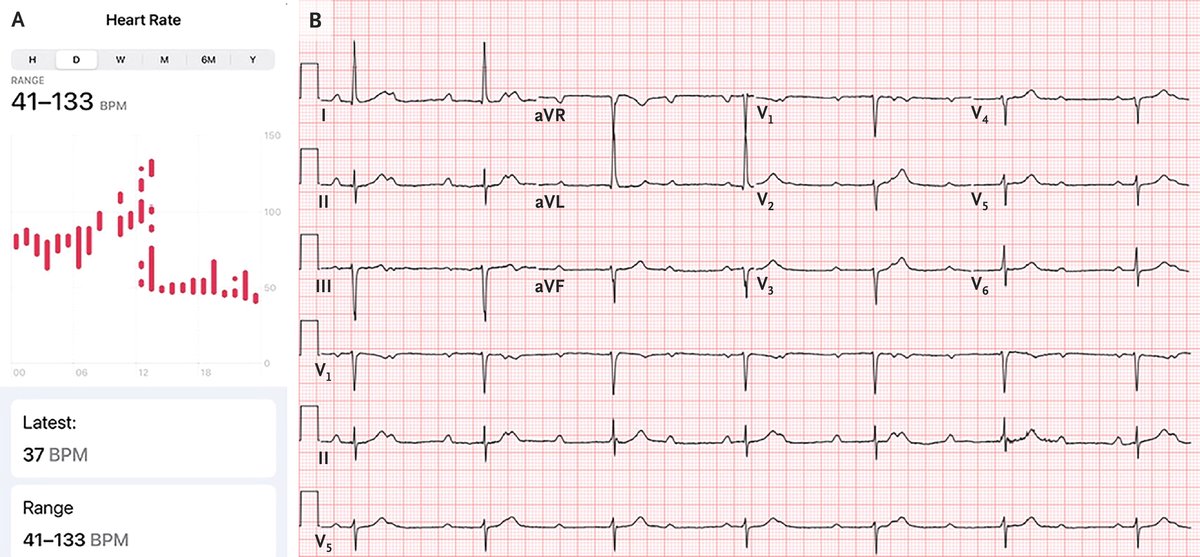
Figure 7
Multi-panel: Labeled MRI and X-ray images
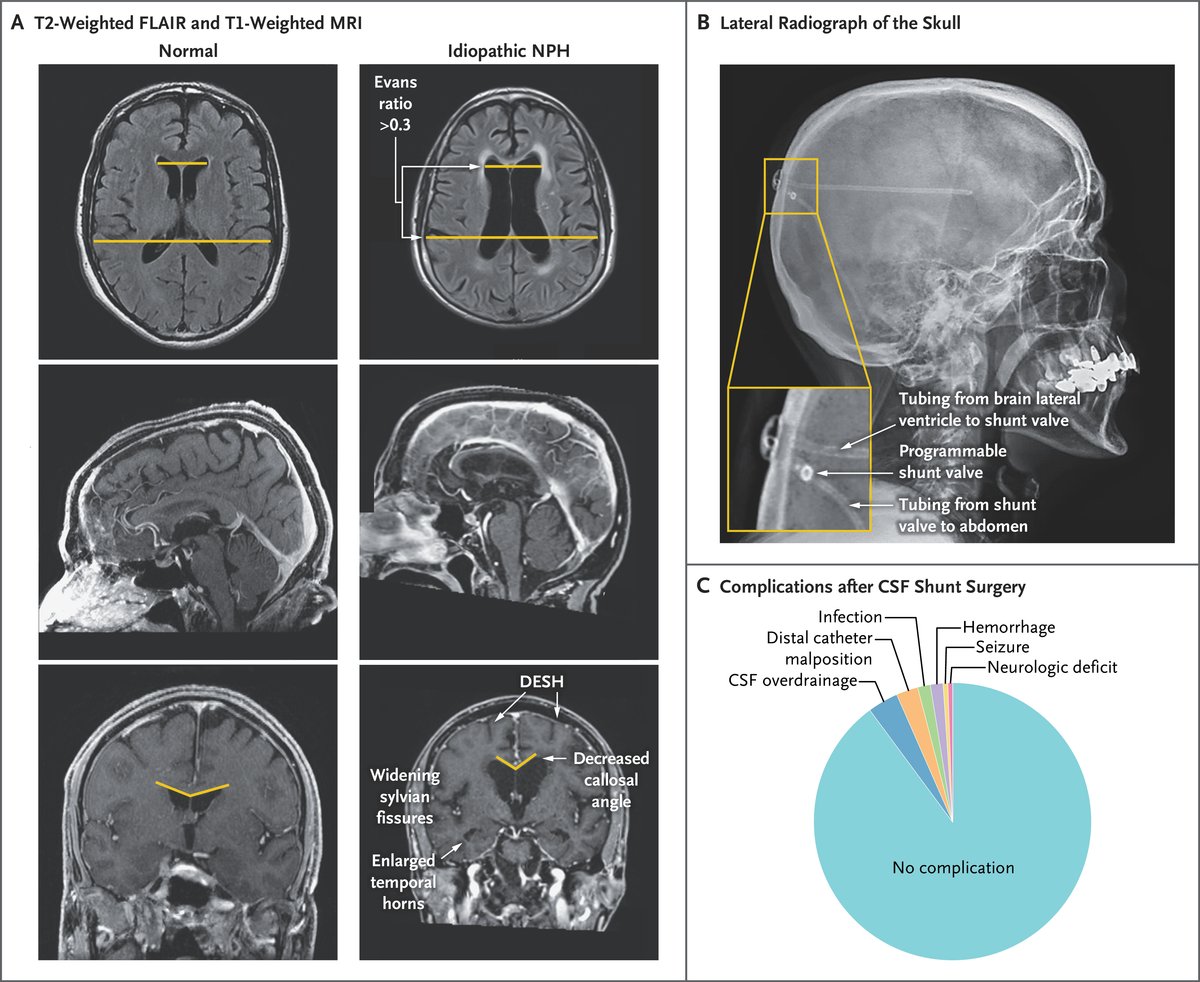
Figure 8
Multi-panel figure

Figure 9
Multi-panel figure
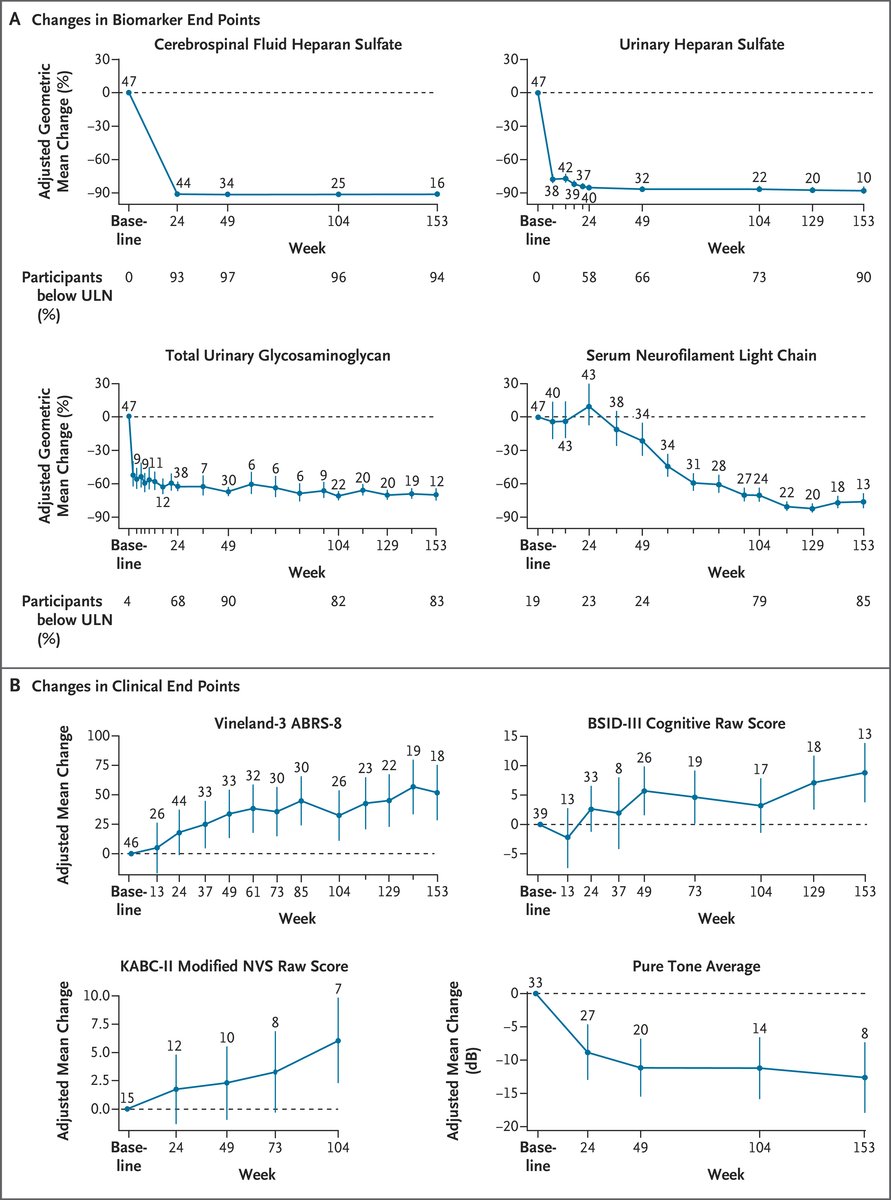
Figure 10
Multi-panel: Bar graph and heat map
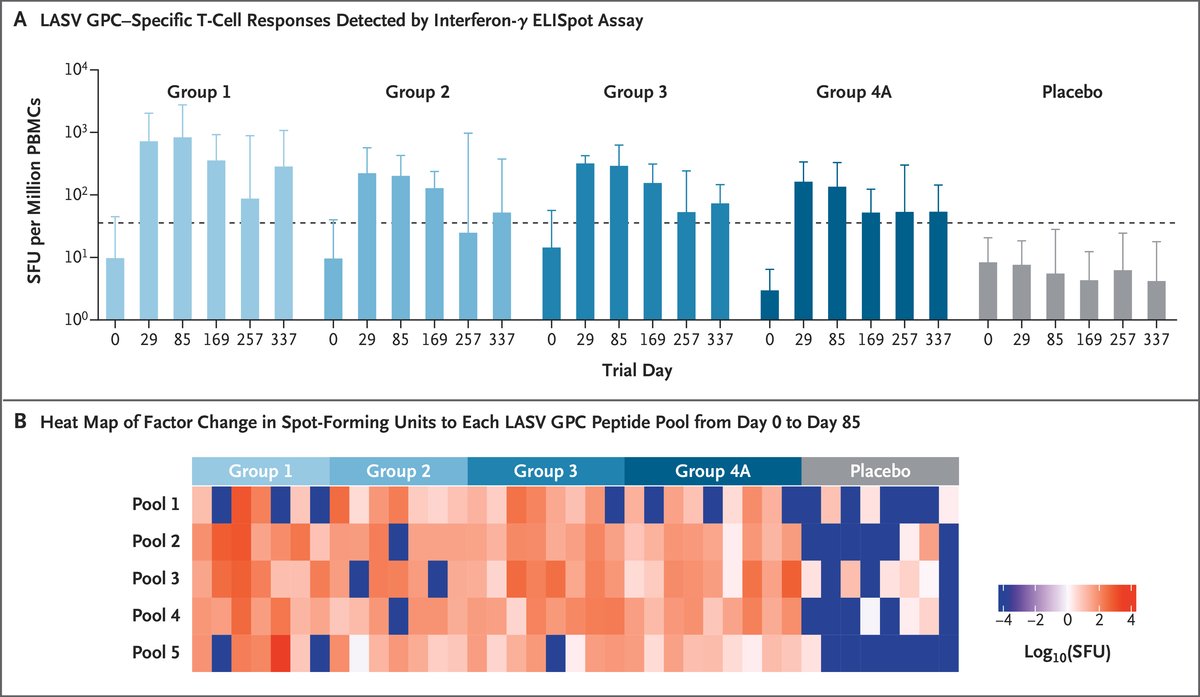
Figure 11
Multi-panel figure
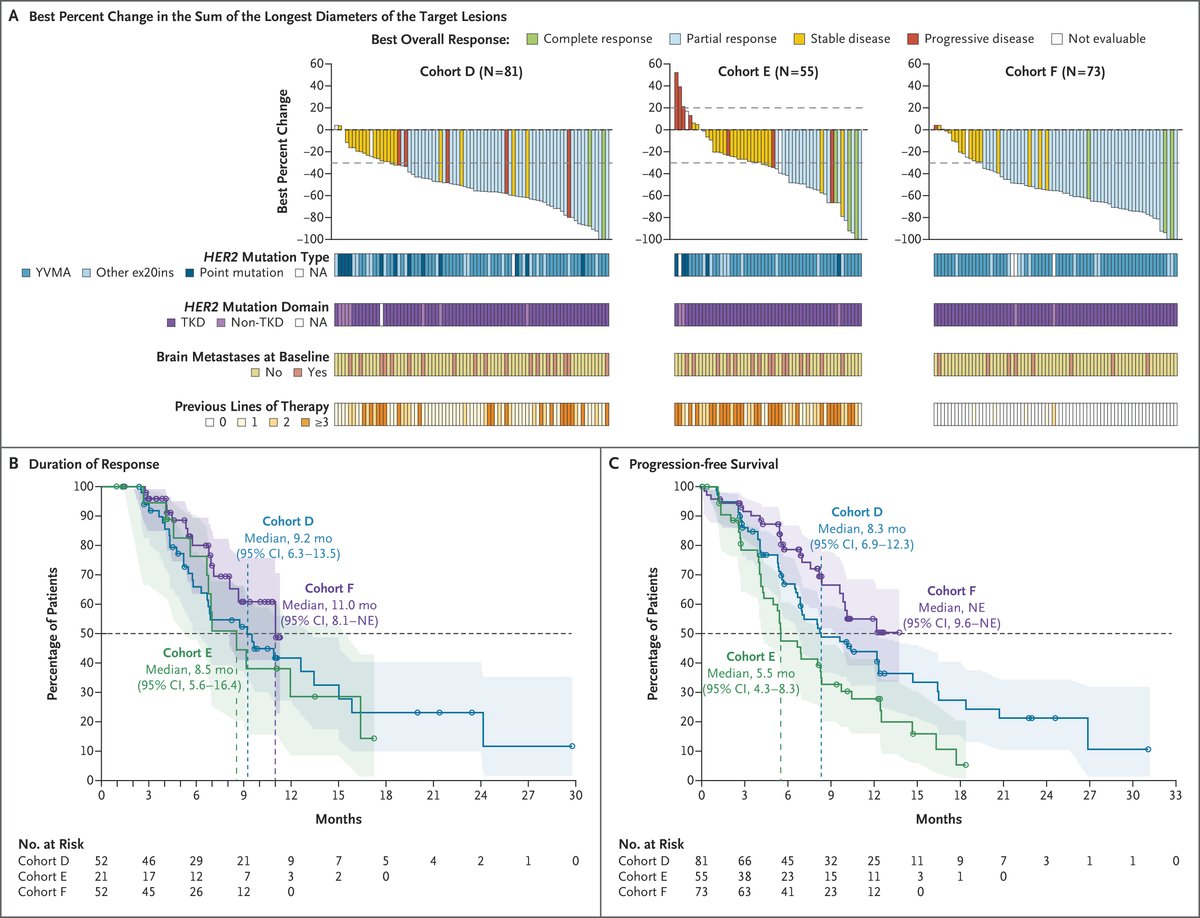
Figure 12
World map - choropleth
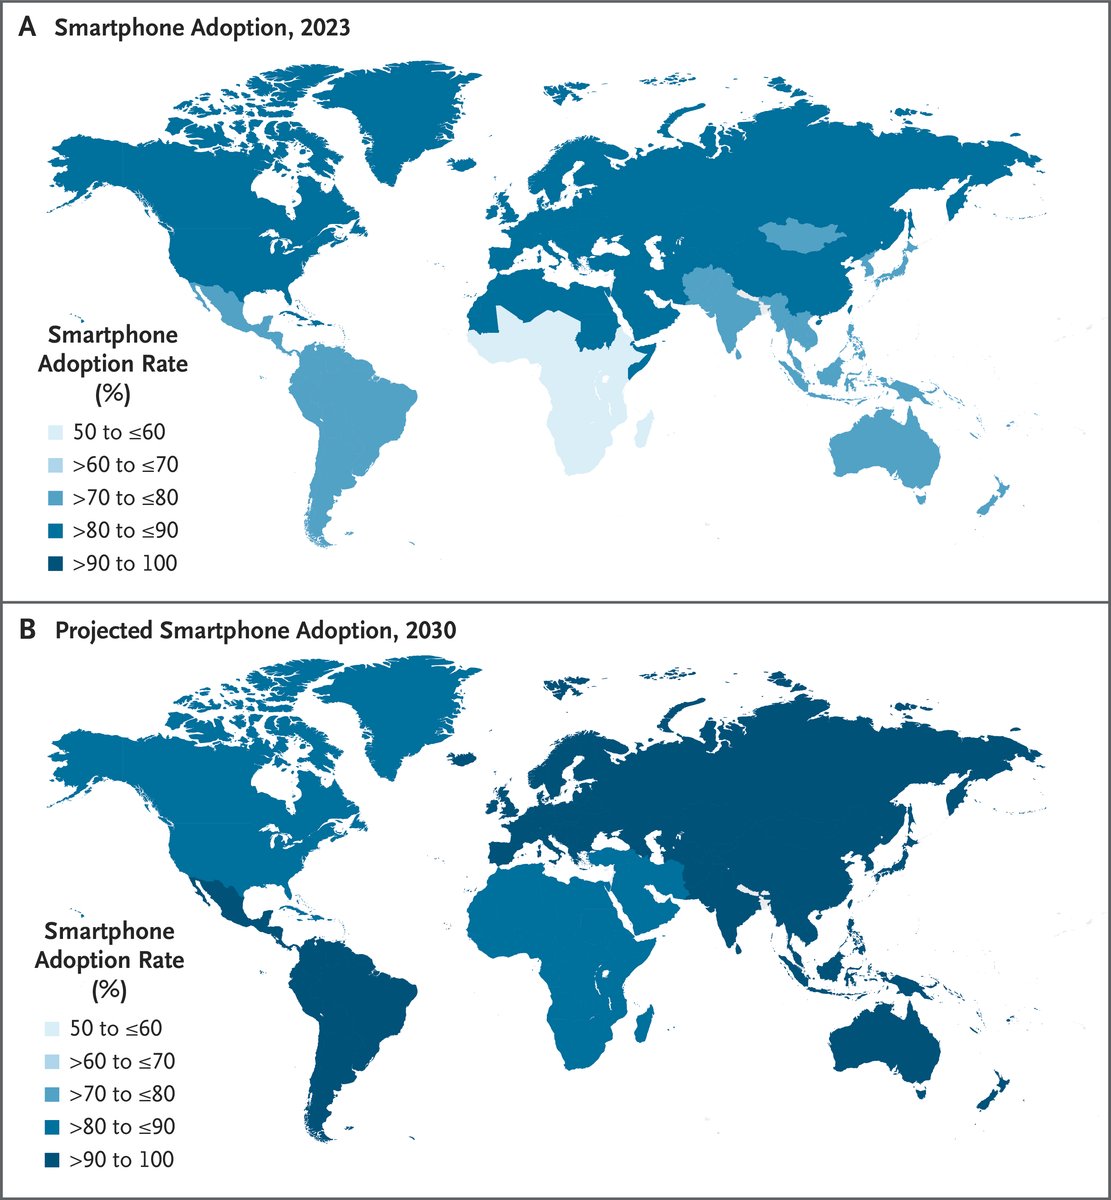
Figure 13
Multi-panel: Data graphics and endoscopic and histologic photos
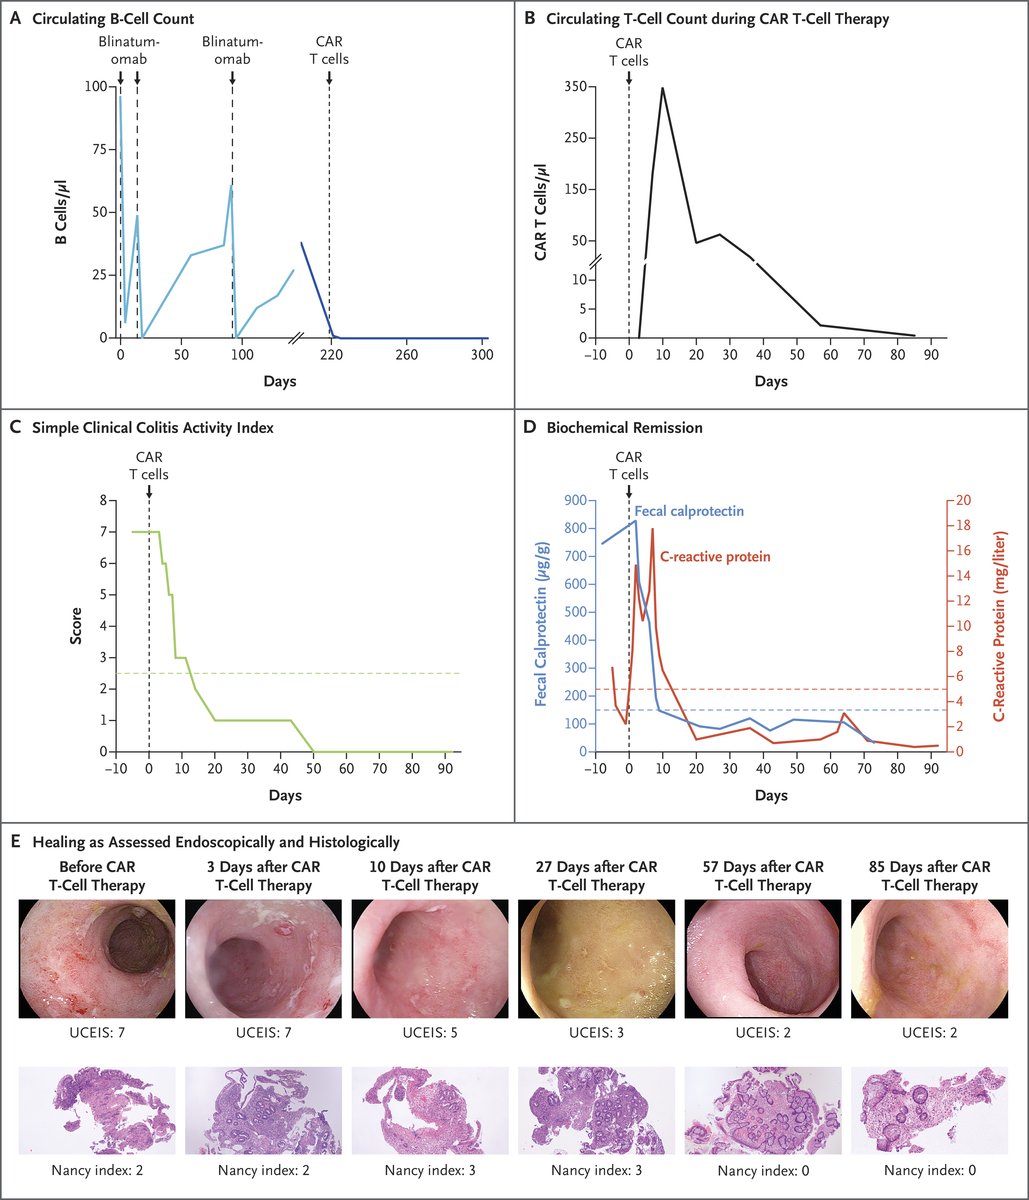
Figure 14
Photos of treatment and use of baby wraps
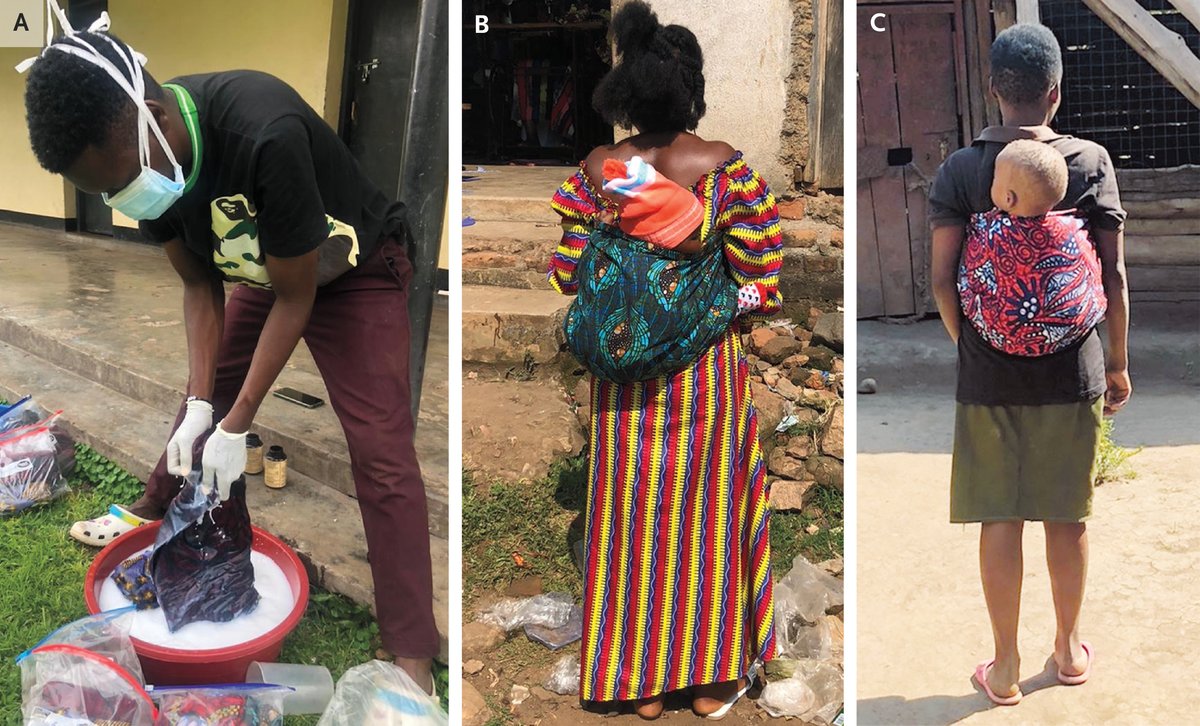
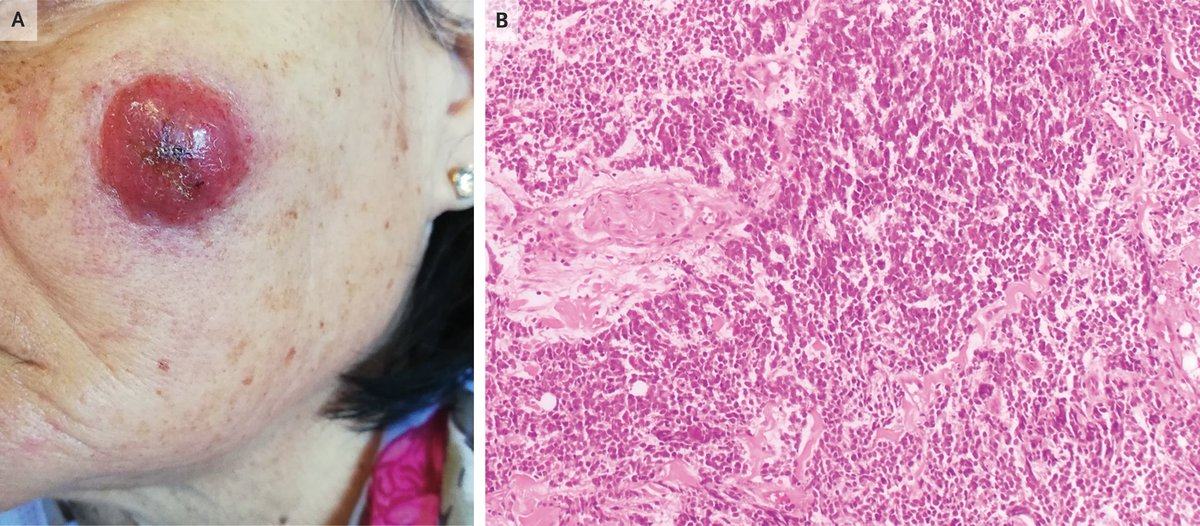
Figure 15
Patient photo and histologic slide